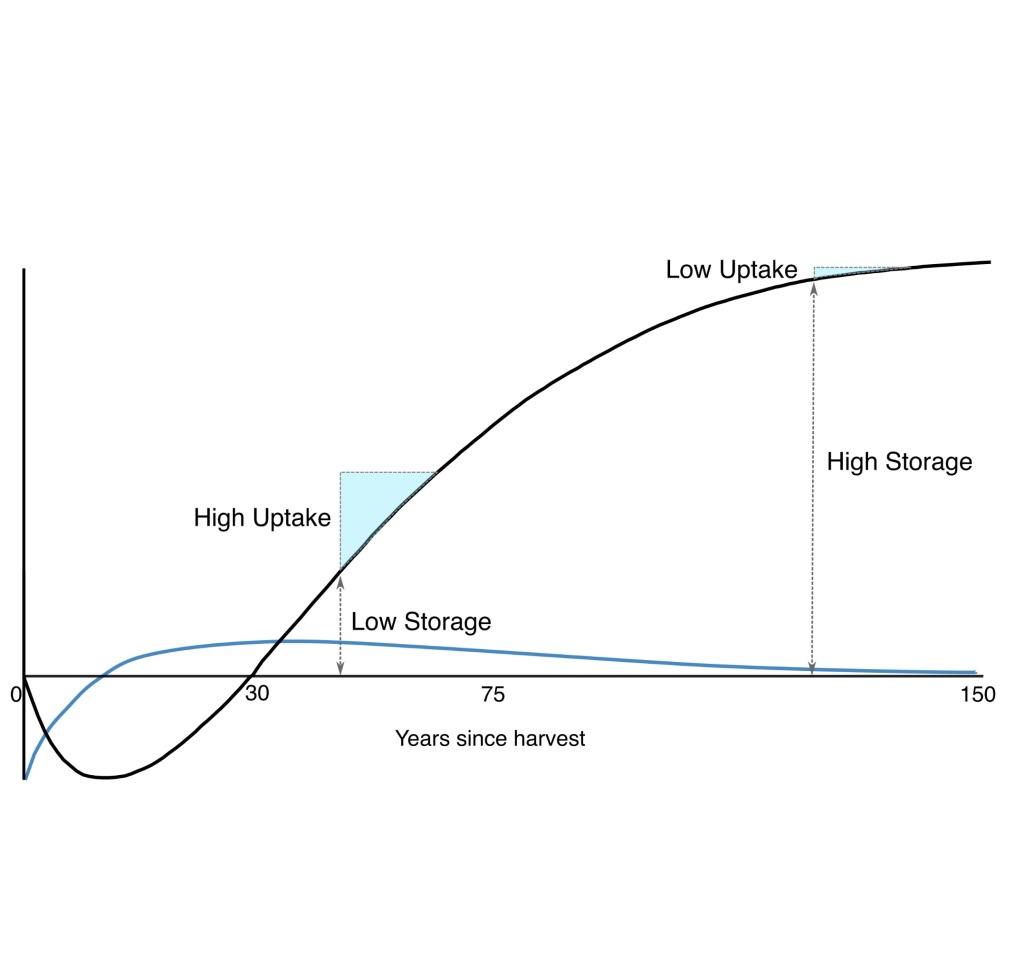
Tell a story with your data
The right graphs and charts can make it easier to spot trends & patterns, and make complex information clear, concise, and immediately easy to understand.
Adding Illustrative & Narrative elements tailored to your specific data and audience will help to tell a story that is relatable, accessible, and memorable.
Formats for Data Storytelling
Data Visualization

Illustration

Narrative

Humour

